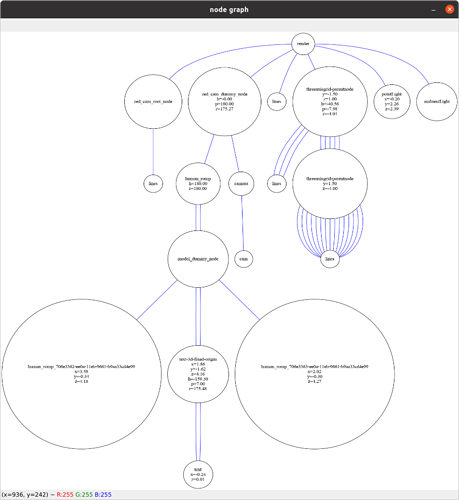
When the project gets huge I often find it difficult to keep track of all the nodes that are present in a scene graph. Here is a simple code to plot scene graph:
import panda3d.core as p3d
import pydot
import cv2
import numpy as np

def get_label(node: p3d.NodePath):
    """
    Get relevant values from a node path

    :param node:
    :return:
    """
    x, y, z = node.getPos()
    h, p, r = node.getHpr()
    label_dict = {'x': x, 'y': y, 'z': z, 'h': h, 'p': p, 'r': r}
    label = ''
    for key, value in label_dict.items():
        if value == 0:
            continue
        label += '{}={:.2f}\n'.format(key, value)
    return label


def draw_scene_graph(rootnode: p3d.NodePath, graph: pydot.Dot = None, node_idx=0):
    """
    A simple visualization function for the scene graph

    :param rootnode: The reference node whose children you wish to visualize
    :param graph: pydot graph, leave to None to automatically create a new graph
    :param node_idx: current node index, do not change, used for recursion
    :return: image of the graph
    """
    if graph is None:
        graph = pydot.Dot('my_graph', graph_type='graph', bgcolor='white')
    label = rootnode.name
    info_label = get_label(rootnode)
    if info_label != '':
        label += '\n' + info_label

    graph.add_node(pydot.Node(str(rootnode), shape='circle', label=label))
    if len(rootnode.ancestors) > 1:
        graph.add_edge(pydot.Edge(str(rootnode.ancestors[1]), str(rootnode), color='blue'))

    for childnode in rootnode.children:
        draw_scene_graph(childnode, graph, node_idx + 1)
    if node_idx == 0:
        im_buf = graph.create_png()
        im_arr = np.frombuffer(im_buf, 'uint8')
        im_cv = cv2.imdecode(im_arr, cv2.IMREAD_ANYCOLOR)[..., ::-1]
        return im_cv
Sample Usage:
import panda3d.core as p3d
import matplotlib.pyplot as plt
root  = p3d.NodePath('root')

child1 = [root.attach_new_node(f'child{i}') for i in range(10)]
for child in child1:
    child.setPos(*np.random.rand(3))

child2 = [child1[2].attach_new_node(f'child{i}') for i in range(5)]
for child in child2:
    child.setHpr(*np.random.rand(3))
plt.figure(figsize=(20,20))
plt.imshow(draw_scene_graph(root))
plt.show()
Nodes from my project:
Note:
To view live changes in your graph while panda app is running call the draw_scene_graph function from taskMgr. Show the returned image in opencv or any other library of your choice so you will be able to view new nodes and changing values of x,y,z,h,p, and r in the graph in real time.

