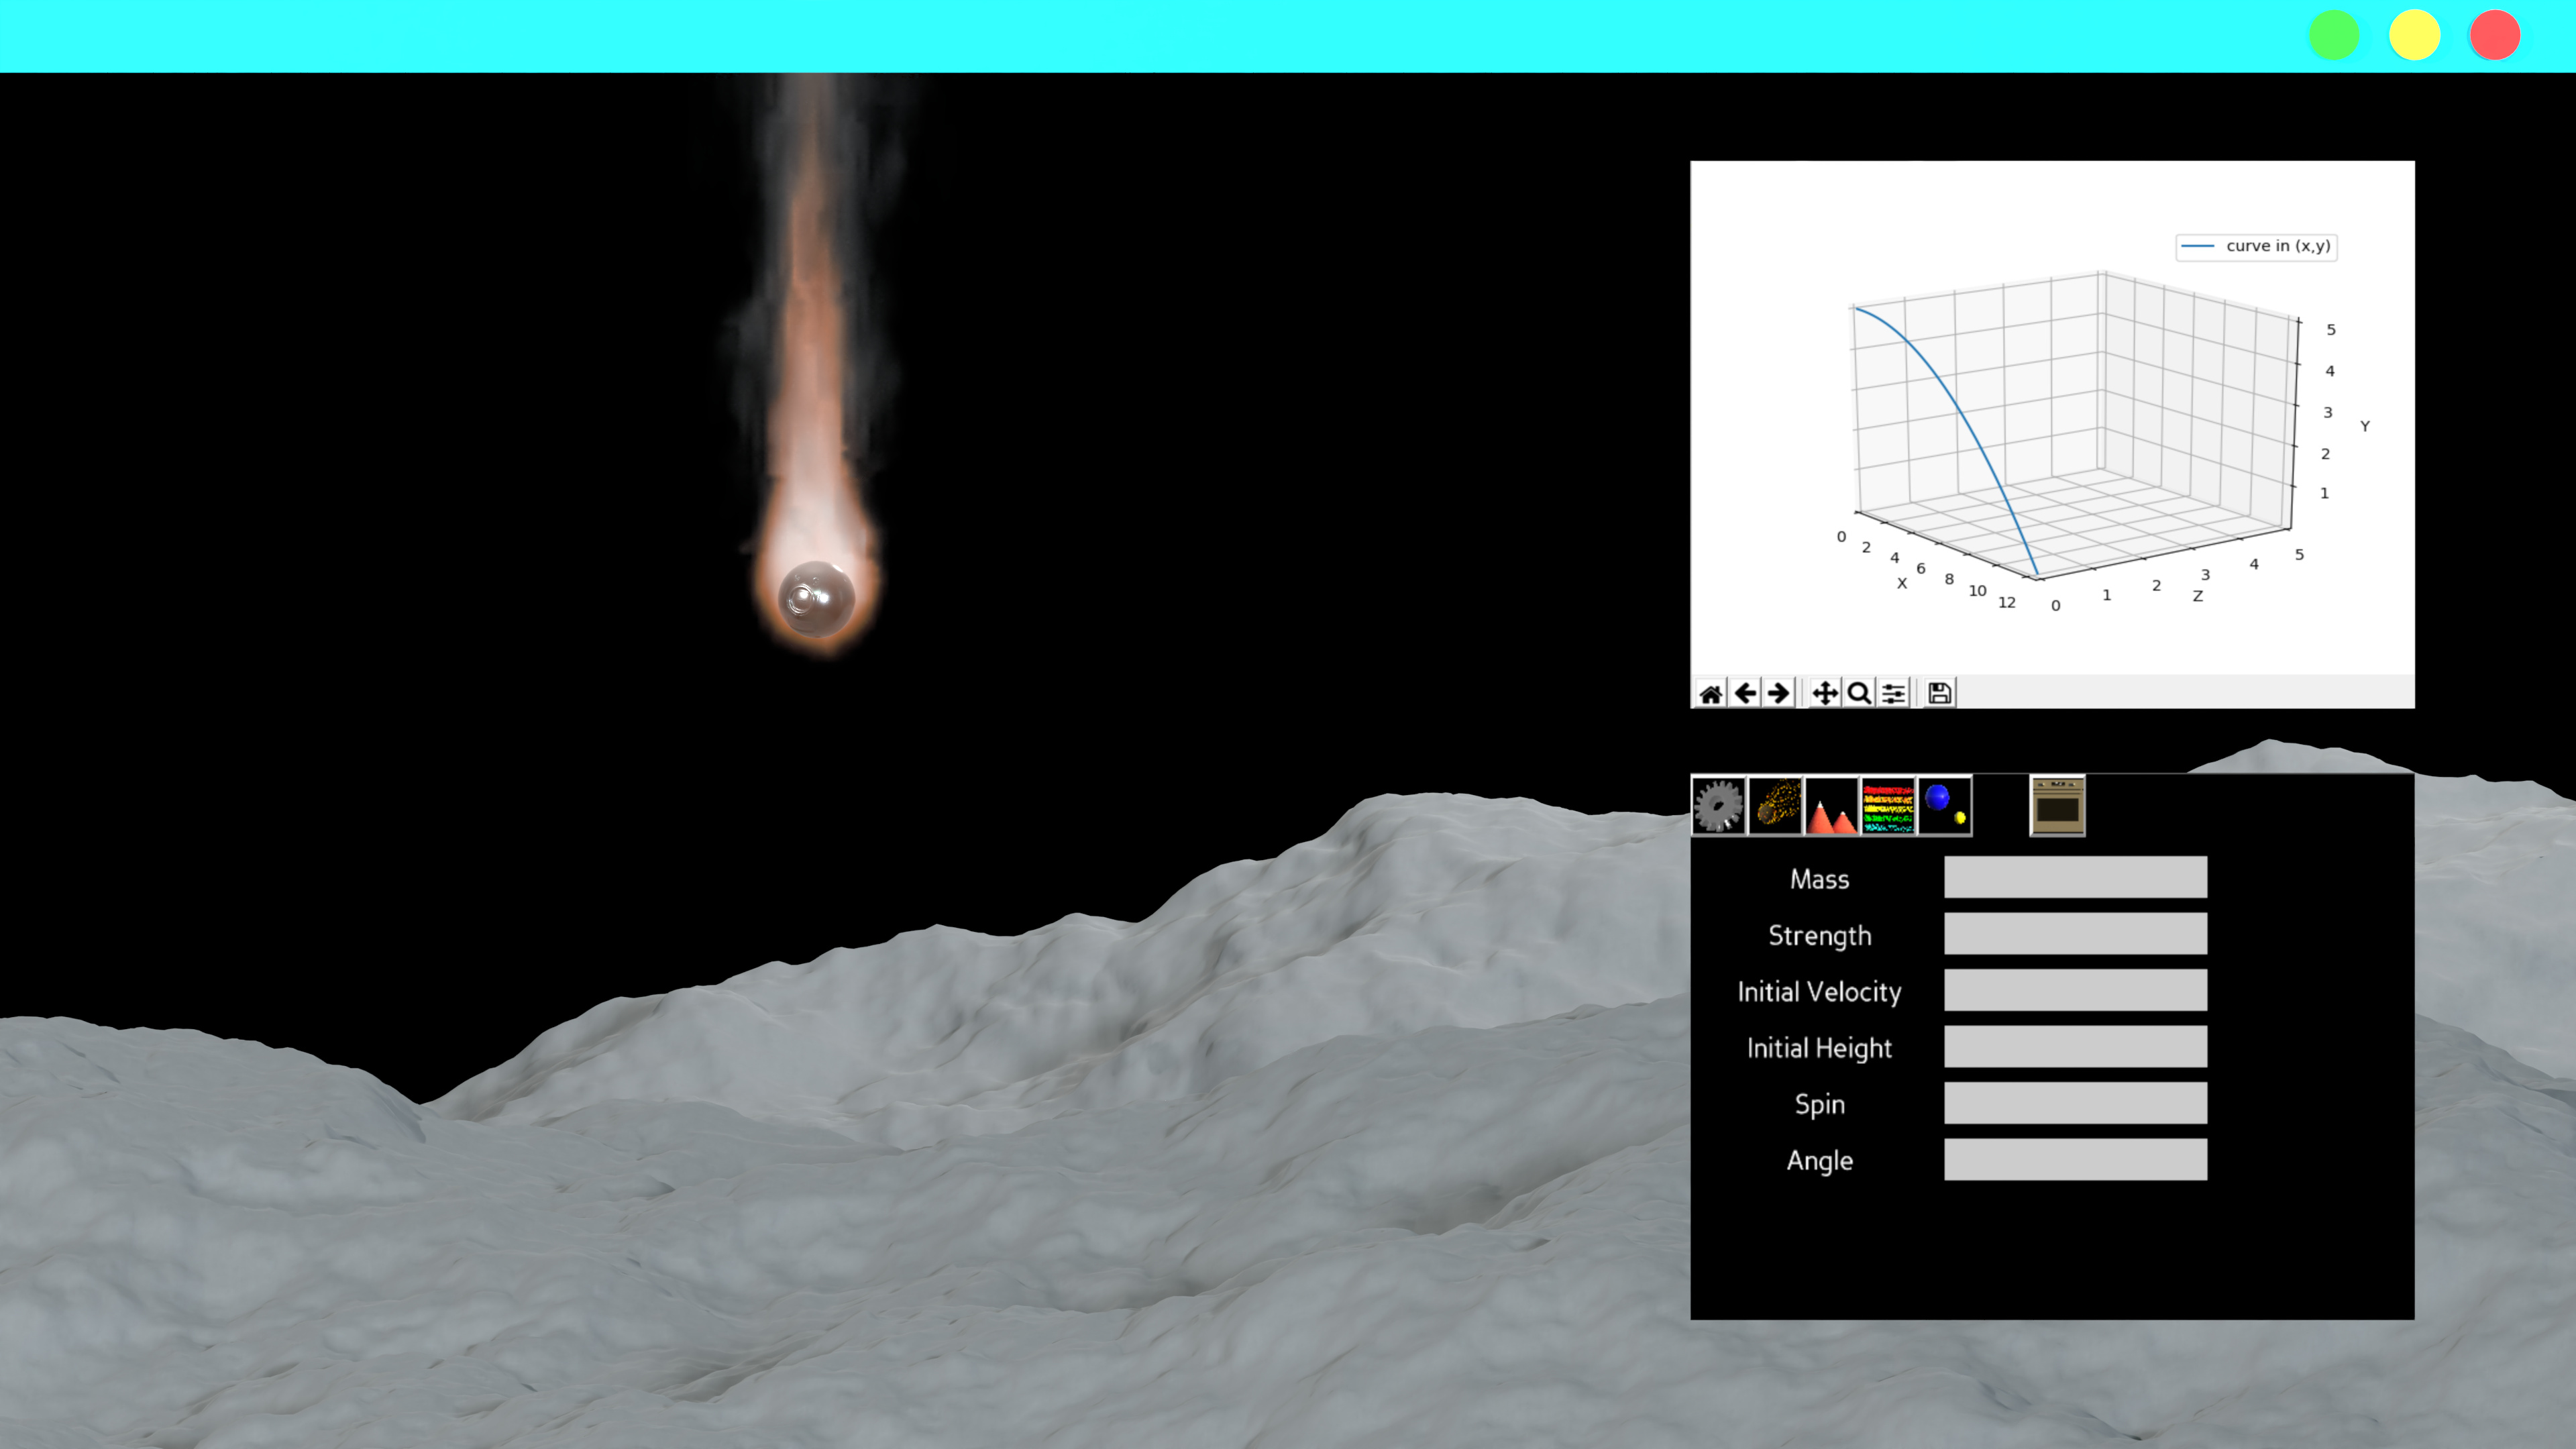
I am a Junior in high school who has volunteered to make a program for NASA, in a competition called HUNCH. I will try to spare the details, because I feel that a proper description would be a lengthy one. But put simply, I am making a simulation that takes variables (etc. mass, initial velocity), to predict if a Lunar Supply Pod would survive a direct impact to the surface of the moon. What I want to do, is put a graph into the main Panda3D display, to illustrate the trajectory of the object towards the moon.
So here is the problem: Currently, I have my program set up to take inputs, and then trace the route taken by the pod-on the way to the surface, using Matplotlib. Unfortunately, it seems that there is no way to put the graph into the same window as the one that displays the simulation. It is difficult to describe, so I made a picture displaying the ideal end result. So this is my question: how can you display a graph in the main Panda3d window?
Hmm… I don’t know Matplotlib, but if there’s a way to get an image or texture out of it, that could perhaps be applied to a card (that is, a quad) in Panda and thus rendered.
To get it into a Panda3D Texture object, you can create a Texture with the right dimensions, format and component type, and then you can call setRamImage(img, "RGB") where img is some type of byte buffer object that other imaging libraries usually have a way to obtain raw image data in.
Then you can apply the texture to a card, or something like that.
I’m trying to use the code listed in the solution today and I’m running into some issues:
First when I run the code it opens a single blank window that quickly disappears and I get the following error:
Known pipe types:
  glxGraphicsPipe
(1 aux display modules not yet loaded.)
Xlib:  extension "XFree86-DGA" missing on display ":0".
Traceback (most recent call last):
  File "/unix/Desktop/apps/project/src/test.py", line 60, in <module>
    App()
  File "/unix/Desktop/apps/project/src/test.py", line 39, in __init__
    self.startWx()
  File "/unix/.local/lib/python3.10/site-packages/direct/showbase/ShowBase.py", line 3115, in startWx
    self.spawnWxLoop()
  File "/unix/.local/lib/python3.10/site-packages/direct/showbase/ShowBase.py", line 3145, in spawnWxLoop
    self.wxTimer.Start(1000.0 / wxFrameRate.getValue())
TypeError: Timer.Start(): argument 1 has unexpected type 'float'
and then running the code again opens two blank windows, which both quickly disappear and I get the warning:
Known pipe types:
  glxGraphicsPipe
(1 aux display modules not yet loaded.)
Xlib:  extension "XFree86-DGA" missing on display ":0".

(test.py:46687): Gdk-WARNING **: 14:51:50.557: ../../../../../gdk/x11/gdkwindow-x11.c:5653 drawable is not a native X11 window
Running again with:
GDK_BACKEND=x11 python3 test.py
Again opens up two blank windows that quickly disappear and get the following warning:
Known pipe types:
  glxGraphicsPipe
(1 aux display modules not yet loaded.)
Xlib:  extension "XFree86-DGA" missing on display ":0".
So my question is:
Is this code supposed to be displaying something?
And if so, how do I fix it?
And if not, how would I go about displaying a matplotlib plot?