I’m attempting to diagnose a performance issue in my project, and the standard PStats output has pointed me to the “Wait” bin under “frame”.
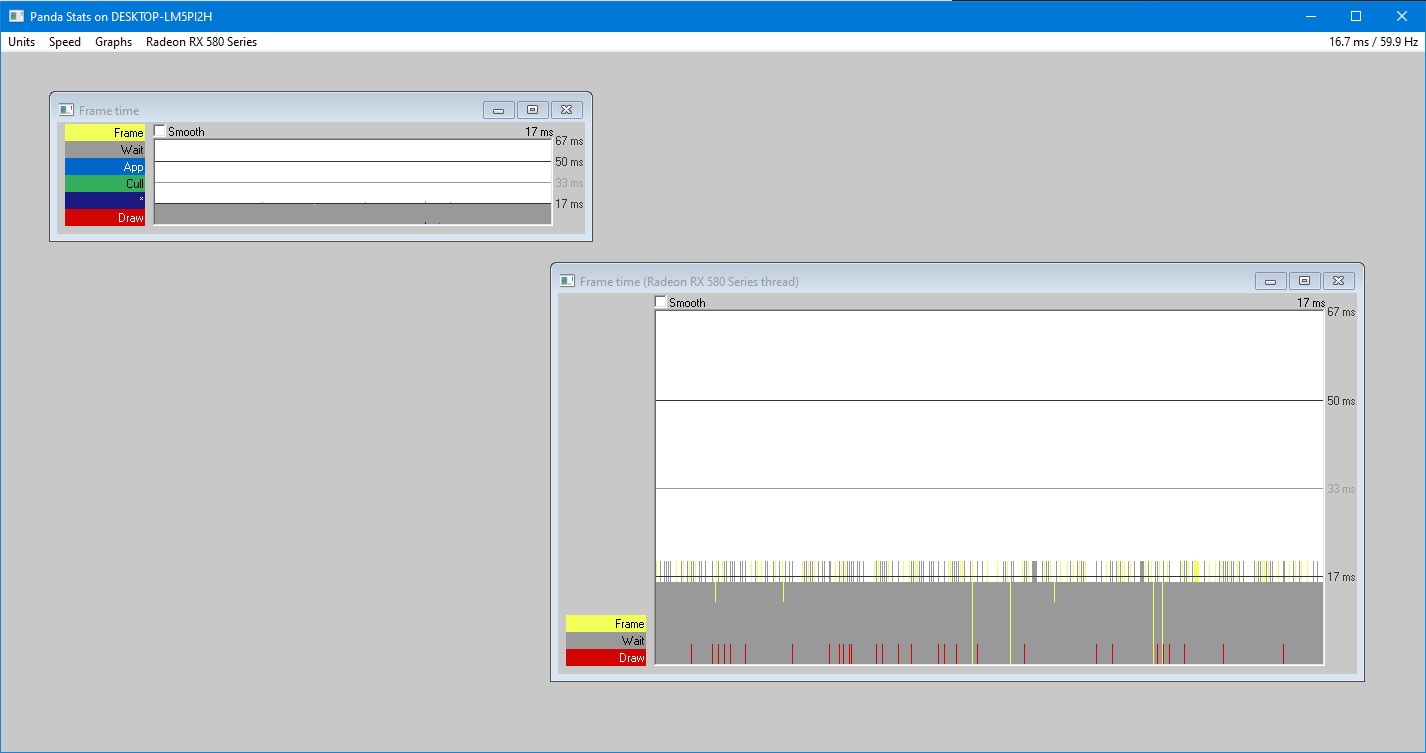
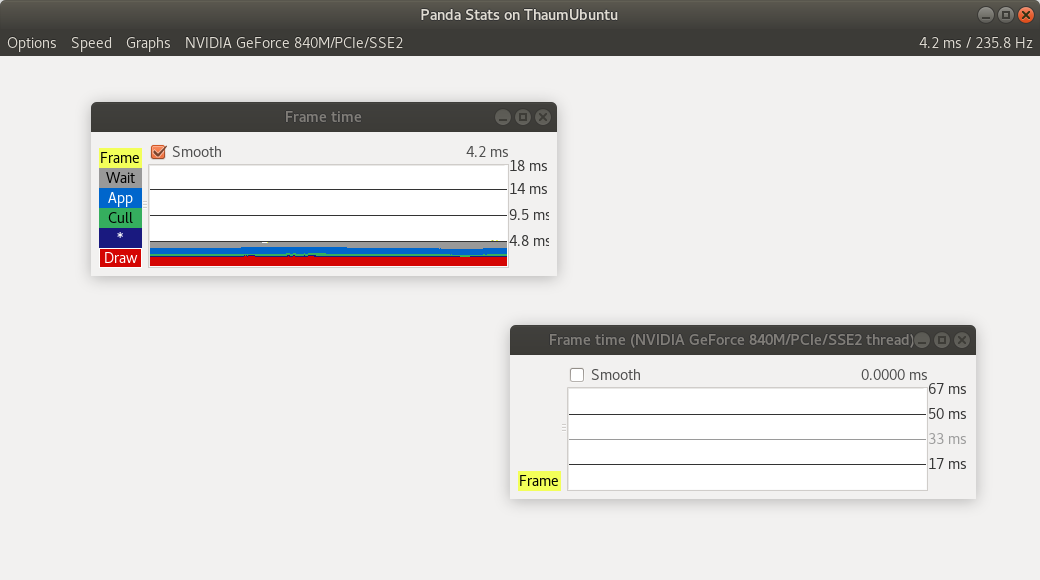
This, then, has prompted me to want to see what my GPU is doing. To that end I set “pstats-gpu-timing 1” in a call to “loadPrcFileData” at the start of my program, and re-ran the program. As expected, this resulted in PStats offering a menu for my GPU, containing menu-items for a handful of graphs.
However, these graphs don’t seem to work: No graphs are drawn over the backing scales, and the “frame” graph remains fixed at 0.0000ms.
These graphs used to work, as I recall–I’ve found them very handy in the past, I believe!
So, what might have happened here? Something related to an update in Panda, or in my drivers, or both?
For reference, my environment is as follows, I believe:
Python version: 3.6.9
Panda version: 1.10.10
Graphics card: NVidia GeForce 840M
OS: Ubuntu 18.04.6
Graphics driver: “NVidia driver metapackage from nvidia-driver-470”
(As my computer does also have an integrated Intel card, I’ve checked that the machine is in fact using the NVidia card. As far as I see, it should be. And in any case, I doubt that I would likely get the performance that I am getting with the integrated Intel card!)