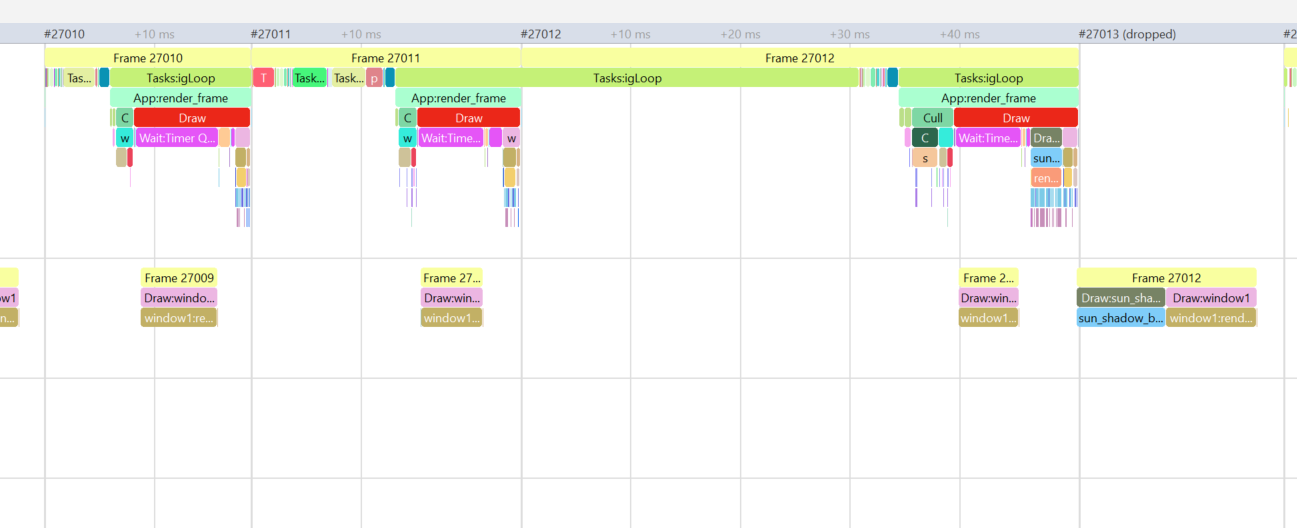
I am getting bad 1% lows, and just can’t seem to figure out why “igLoop” takes soo long (sometimes 50ms or more).
It’s periodical. I was suspecting some kind of buffer overflow, but dont know what buffer is relevant it.
The game has really good performance, the app side was optimized really well, but I just can’t seem to get a grip on why “igLoop” takes so long.
I’ve tried setting pretty much all of the config variables that seemed relevant, but nothing solved it.
It’s not the garbage collection, because it keeps happening even if garbage collection is fully turned off
I also tried model-cache-flush 0 and disconnecting the pstats client
vsync is off
Some more information:
This is my panda3d version:
(g2clone-build) PS C:\Users\Admin\Desktop\prsnl\gamedev\g2-clone\src\_helpers> python .\compile_flags.py
version:      1.11.0
compiler:     MSC v.1916 64 bit (AMD64)
build date:   Apr 15 2025 08:45:05
git commit:   eae39b339ca3ba5e0271f353927cd02a433fe66b
loaded file:  core.cp311-win_amd64.pyd
=> this is a *release / optimised* build
- I’ve tried manually flipping, but resulted in more worse performance
- The game has many NPCs, if I dont load any NPCs, then the problem effectively goes away, looking at the pstats timeline, there is no more overhanging igLoop. However, the game obviously requires NPCs, several of them. I have around 70-100 NPCs loaded at the same time
- I recently added LOD-s for NPCs, in hopes it would fix it, but even though overall performance improved, I’m getting the fps drops from the igLoop exactly the same way.
- there are no significant additional framebuffers, apart from shadow projection, but turning it off does not help
- The hitching happens roughly every 1 second, but occasionally happens in more arythmic intervals too (the 1 second hitch always happens)
There may be other factors, such as overheating of the hardware due to poor cooling. A common problem on laptops.
I have a desktop, and a laptop, with great cooling.
This is the system I’m using
| Device name | DESKTOP |
|---|---|
| Processor | AMD Ryzen 5 5600X 6-Core Processor 3.70 GHz |
| Installed RAM | 64.0 GB |
| Device ID | 2F9D4428-72EE-4559-BBA9-31418DBDA2F5 |
| Product ID | 00330-80000-00000-AA624 |
| System type | 64-bit operating system, x64-based processor |
| Pen and touch | No pen or touch input is available for this display |
GPU is:
GPU 0
AMD Radeon RX 6700 XT
Driver version:	32.0.12033.1030
Driver date:	27/11/2024
DirectX version:	12 (FL 12.1)
Physical location:	PCI bus 7, device 0, function 0

Utilisation	4%
Dedicated GPU memory	5.1/12.0 GB
Shared GPU memory	0.4/32.0 GB
GPU Memory	5.5/44.0 GB
I understood you correctly that there is no difference between a desktop computer and a laptop in the behavior of igLoop.
Cooling can be great from a marketing point of view, but it is important that the temperature sensor does not show overheating, for example, dust leads to a deterioration in laptop cooling.
Correct, the same thing happens on the laptop. the laptop is a new Asus Vivobook with a AMD Ryzen™ AI 9 HX 370. the game runs on the laptop remarkably well too, especially if I turn off the GPU intensive shadow projection buffer. I take care of the computers, and they both perform well in various heavy workloads. to me the current issue points to a scripting or pipeline configuration issue, not hardware issue.
btw, I know exactly what you mean by overheating. At one time I was taking apart my previous laptop and putting the motherboard in the freezer to keep playing dota 2 ![]()
Hi, welcome to the community!
This is very odd, but the fact that the Timeline suggests it’s not doing anything during those long frames suggests that other applications might be doing things in the meantime?
1 Like
Hi, thanks for the welcome. I’ve been reading the forums and the docs for a while.
I’m trying to isolate the issue, now by building a separate minimal app that only generates a big terrain and a lot of NPCs. So far with not much luck, the igLoop issue does not come up, even with 500 no-LOD (fully rendered) npcs
I am thinking in the main game app it may be a combination of several subsystems somehow filling up some kind of buffer, or running into some periodic issue, but even reading the c++ code of render_frame, I cant figure out what it could be.
It’s not a shader issue, if I completely disable all Shaders, the issue still persists.
I would rule out external programs causing the issue, not much is running apart from the python script.
I’ll keep experimenting with disabling certain things selectively, and testing more with minimal apps. Any insight or advice is welcome.
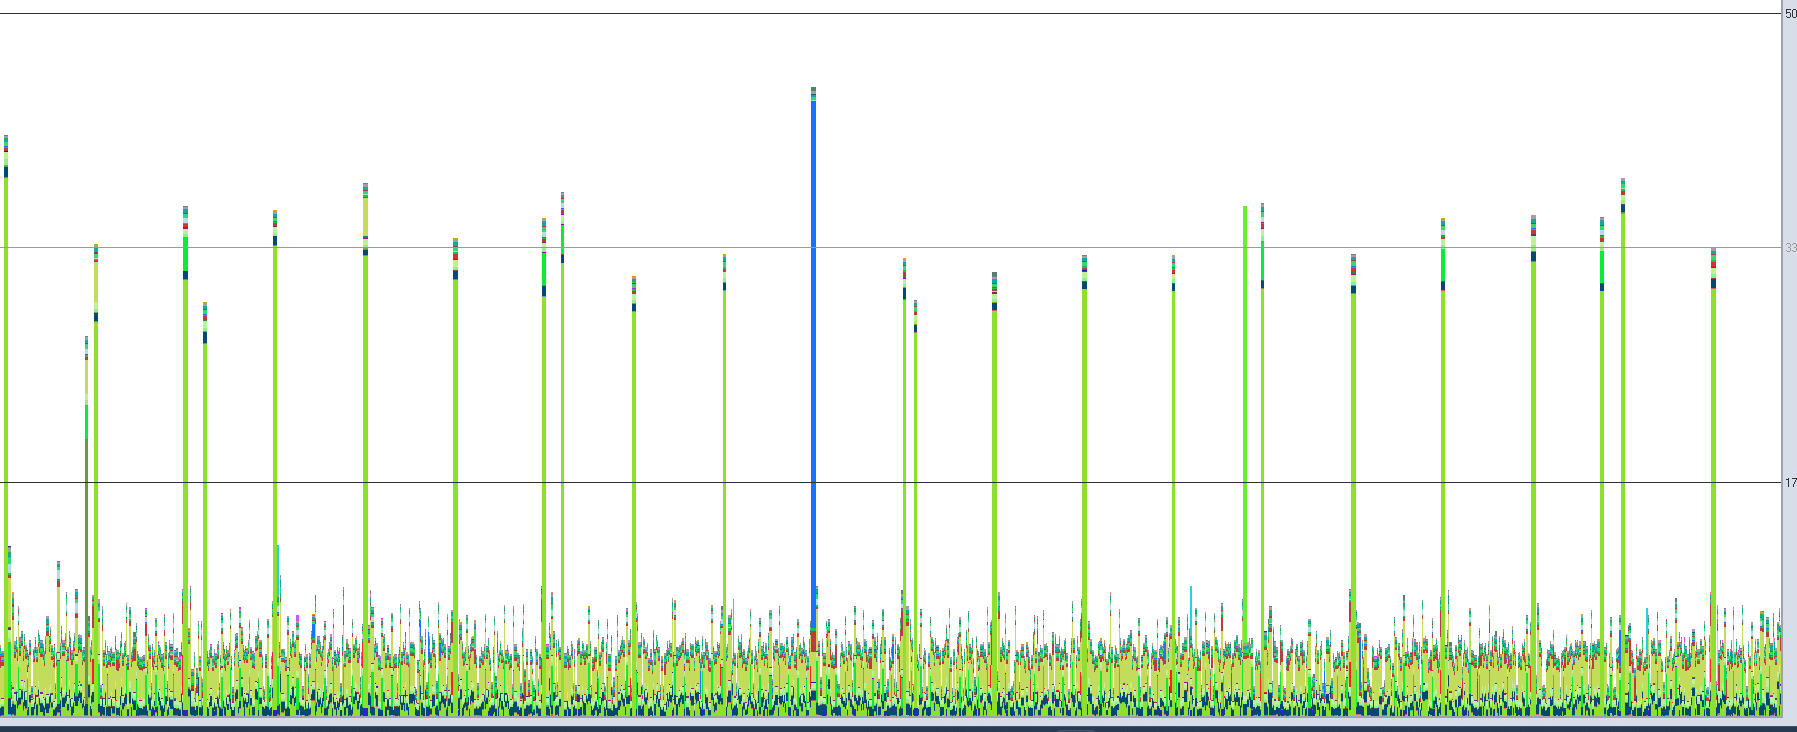
1 more piece of information, here is a nice screenshot of the situation in the old pstats (1.10 pstats), it shows that the issue is periodic, the periodic lime green tall line is the igLoop (and not much else can be measured from it as far as I can tell). The blue tall line is an app task (some of which also do the hitching sometimes), but it’s strange that the igLoop line seems to be missing in that period.
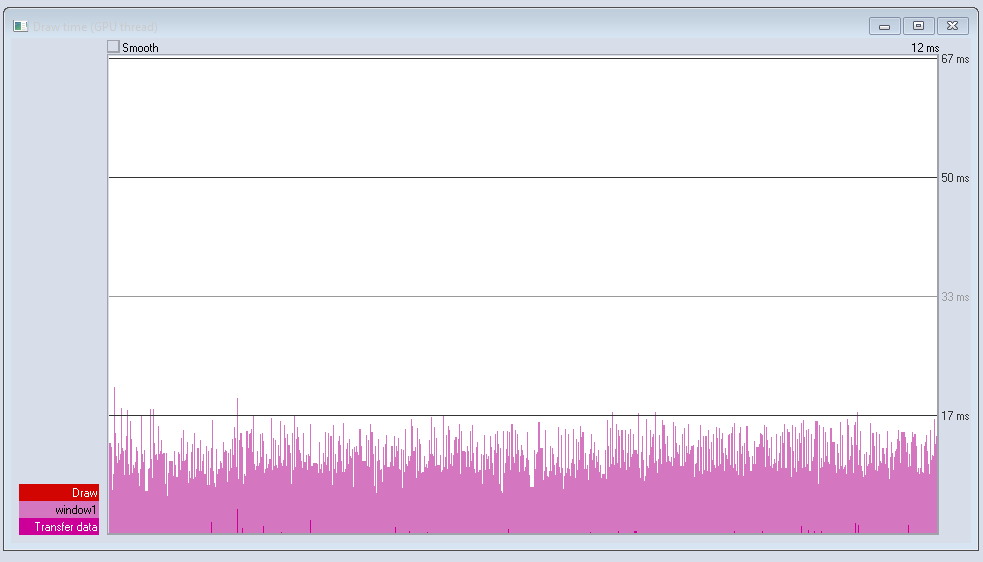
I got 1 more here, this is the GPU draw time. Looks quite stable and smooth.
Can it be that something accumulates into some kind of buffer then get flushed kinda periodically (or as it gets full), and that hangs the app thread (could explain why it’s often igLoop, but not always)
I think you might be right.
I have multiple python processes running, and heavy processing is being passed into these subprocess executors, and then the results of the heavy processing are applied back on the main thread.
I turned off the Tasks that interface with these NPC related subprocesses (which are for different levels of NPC behavior/decision making) and now the 1% lows are improved significantly!
I think one thing I didnt think about is the impact of that heavy processing in the subprocesses. I assumed it will simply go on different CPU cores, since I have a lot of cores free.
I’ll research into this, but probably the solution should be to better allocate resources for these subprocesses or to give them lower priority.
Thanks for the help.
It looks like the situation is under control.
It seems there were user app threads in the main process. These threads were collecting results of the calculations from the spawned processes through a pipe. I dont yet fully understand why it was periodic, but they were blocking due to acquiring the GIL. This is why it was hard to debug.
I’ll switch the whole concept to a shared memory approach that is easier to control. I’ll be back with describing the final solution when its ready.
Glad you figured it out!
1 Like