Game Seems Laggy

So it seems that my game is having a tad bit of lag and I am unsure if it is due to the game engine, some clunky coding, or even my computer.

Just to give a bit of context, my map that I am generating is relatively small, and the enemies spawned on my map number about 6 in total. Each one of these enemies have two different from nodes. One for the hitbox and another for their line of sight.

As I start the game, I can see it tearing just slightly; however, as I eliminate these enemies, the tearing seems to fade away. By the last enemy, it appears quite fine. Am I using too many from nodes for the engine to handle? Or could it be that I am iterating through too much with my Task.cont for the engine to handle? I am not sure what code to include that could really help anyone visualize this, but I hope someone can give some insight.

As a side note, my laptop is quite old. While the specs seem capable enough with a 2.6 GHz Intel Core i7 processor and an NVIDIA GT 750m graphics card, my laptop has been having difficulties as of late so I cant rule that out as a potential issue.

I’d suggest running PStats to see a little more precisely where the problem lies.

You can get more-detailed information on how to do so here:
https://docs.panda3d.org/1.10/python/optimization/using-pstats

1 Like

Oh that’s awesome! Thank you!

1 Like

Just to be clear, are you seeing tearing or are you seeing lag? Tearing is not directly related to bad performance, but rather to whether VSync is being used.

Apologies for the delayed response.

I guess I am not too knowledgable on the difference between the two which is why I used them interchangeably. Let me post a video showing the difference and maybe you and @Thaumaturge can both provide input on what you both think concerning this issue.

Here is a video showing gameplay with I have spawned 6 enemies on the map:

Here is a video with only one enemy spawned.

(P.S. I have yet to test it with PStats as it is not compatible with OSX and I havent been able to get to my PC as of yet.)

That looks like a framerate issue–that is, that the number of frames rendered per second is dropping too low.

If you enable the built-in frame-rate meter (see here for instructions), what sort of frame-rates does it report, in each of the cases of a single enemy and of six enemies?

That same page linked above also describes the use of the scene-analyser: if you run something like “render.analyze()” (just once!) in the “laggy” case, what does it print out? (I’m presuming that your scene descends from “render”; if not, adapt the call to your scene.)

Also, since the problem is dependent on the number of enemies, it would be useful to see the output of .analyze() call when just called on the enemy model. It could be that the enemy model is not very optimized.

Wonderful comments! So here’s the data:

FPS for each loaded enemy:

0 enemies: 60 fps
1 enemy: 30 fps
6 enemies: 15 fps

render.analyze with one enemy returns this block of text:

230 total nodes (including 0 instances); 0 LODNodes.
98 transforms; 0% of nodes have some render attribute.
119 Geoms, with 115 GeomVertexDatas and 3 GeomVertexFormats, appear on 115 GeomNodes.
255785 vertices, 255785 normals, 0 colors, 255785 texture coordinates.
GeomVertexData arrays occupy 8007K memory.
GeomPrimitive arrays occupy 691K memory.
147 vertices are unreferenced by any GeomPrimitives.
96 GeomVertexArrayDatas are redundant, wasting 649K.
40 GeomPrimitive arrays are redundant, wasting 168K.
119989 triangles:
9810 of these are on 3282 tristrips (2.98903 average tris per strip).
110179 of these are independent triangles.
7 textures, estimated minimum 86016K texture memory required.

render.analyze with six enemy returns this block of text:

230 total nodes (including 0 instances); 0 LODNodes.
98 transforms; 0% of nodes have some render attribute.
119 Geoms, with 115 GeomVertexDatas and 3 GeomVertexFormats, appear on 115 GeomNodes.
255785 vertices, 255785 normals, 0 colors, 255785 texture coordinates.
GeomVertexData arrays occupy 8007K memory.
GeomPrimitive arrays occupy 691K memory.
147 vertices are unreferenced by any GeomPrimitives.
96 GeomVertexArrayDatas are redundant, wasting 649K.
40 GeomPrimitive arrays are redundant, wasting 168K.
119989 triangles:
9810 of these are on 3282 tristrips (2.98903 average tris per strip).
110179 of these are independent triangles.
7 textures, estimated minimum 86016K texture memory required.

calling analyze() on the enemy itself returns this:

4 total nodes (including 0 instances); 0 LODNodes.
1 transforms; 0% of nodes have some render attribute.
1 Geoms, with 1 GeomVertexDatas and 1 GeomVertexFormats, appear on 1 GeomNodes.
1515 vertices, 1515 normals, 0 colors, 1515 texture coordinates.
GeomVertexData arrays occupy 122K memory.
GeomPrimitive arrays occupy 13K memory.
2175 triangles:
0 of these are on 0 tristrips.
2175 of these are independent triangles.
2 textures, estimated minimum 14336K texture memory required.

I am not quite sure what this all means but it doesnt seem to differ between 6 enemies and 1 enemy? Or am I misinterpreting this?

Okay, so it does indeed seem to be a frame-rate issue, and it does look like it’s likely related to the enemies!

I’m a little surprised that your frame-rate is only 60fps with no enemies, however. But perhaps you have v-sync enabled.

To check, what frame-rate do you get in an empty Panda project–e.g. if you just run the code below?

from direct.showbase.ShowBase import ShowBase

class Game(ShowBase):
    def __init__(self):
        ShowBase.__init__(self)

        self.accept("escape", base.userExit)

        self.setFrameRateMeter(True)


app = Game()
app.run()

It’s very odd indeed that there’s no difference at all between the output of “analyze()” in those two cases–even down to the amounts of memory used. Are you very confident that you pasted the correct text for both? And that your scene is indeed attached below “render”? And that “analyze()” was run after setting up your scene, enemies included?

1 Like

For the record, it does not look like your enemy has particularly many vertices or nodes, so I don’t think that the problem is caused by your model being too complex.

I really recommend using PStats, which will tell us what is taking up your frame time.

1 Like

hi,
another suggestion:
call flatten() and check the performance

1 Like

Okay, so first off, my life has been crazy recently and I apologize for the really slow responses. Yall are the ones helping me out here and yall reply a lot faster haha.

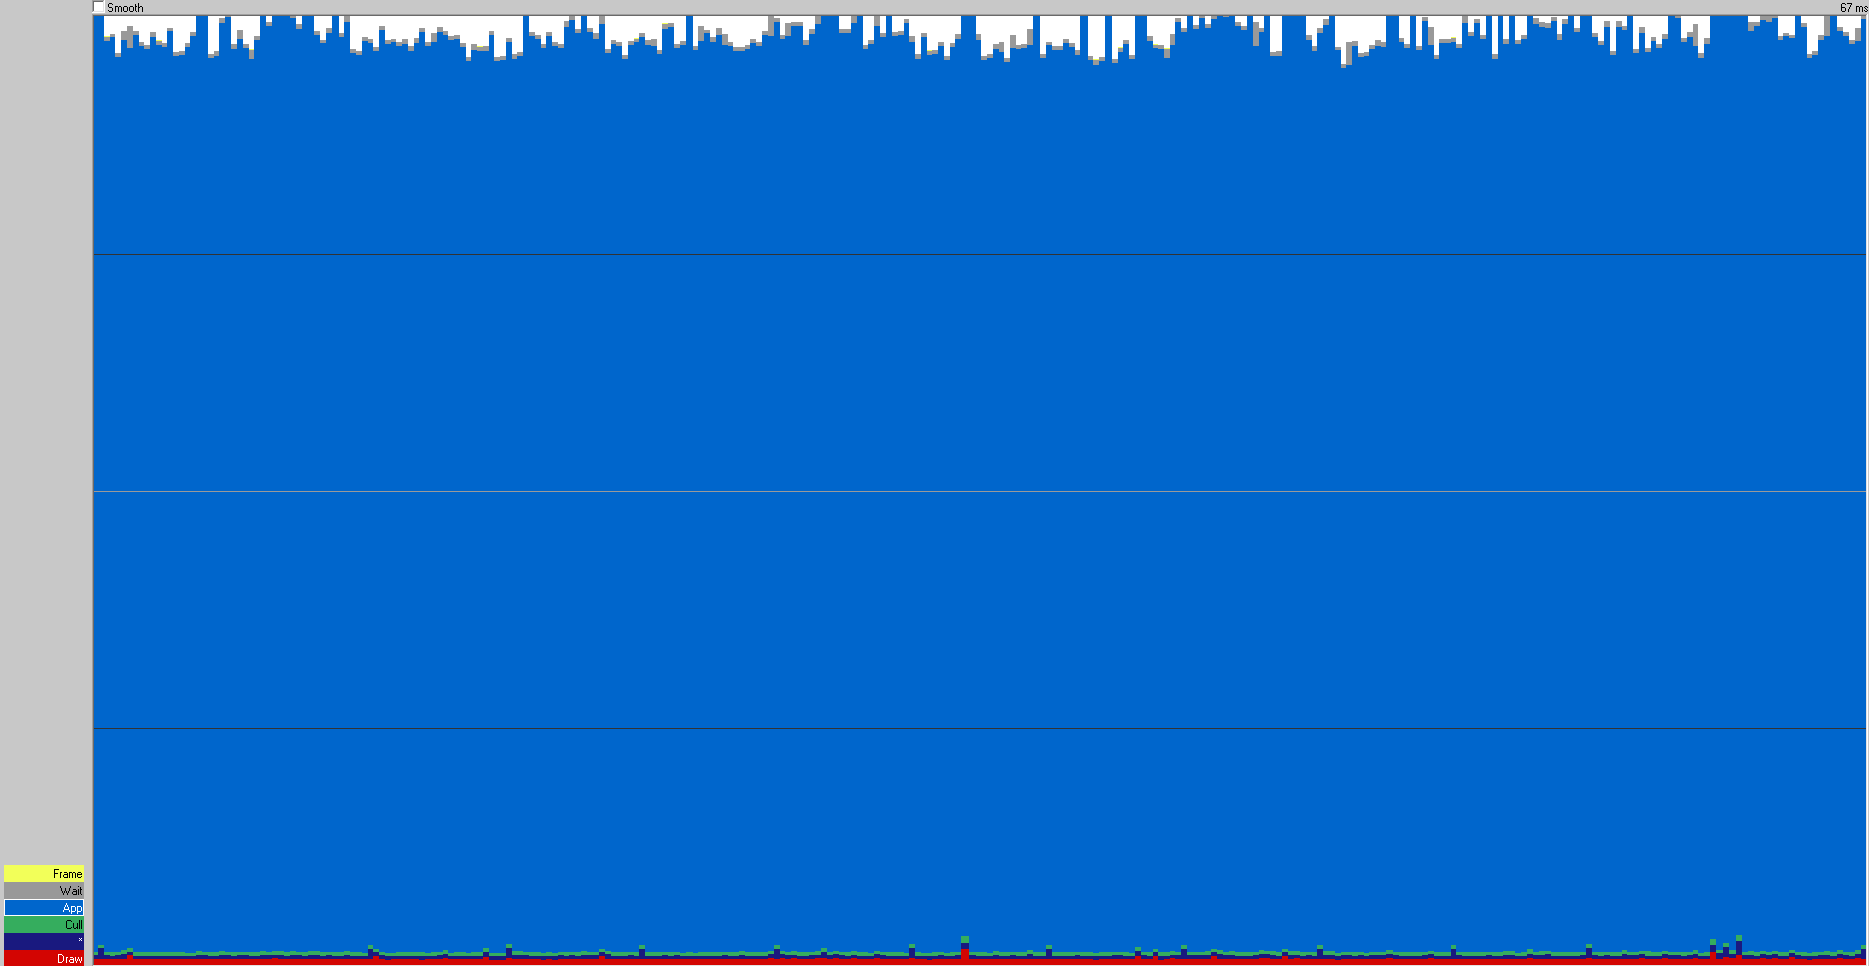
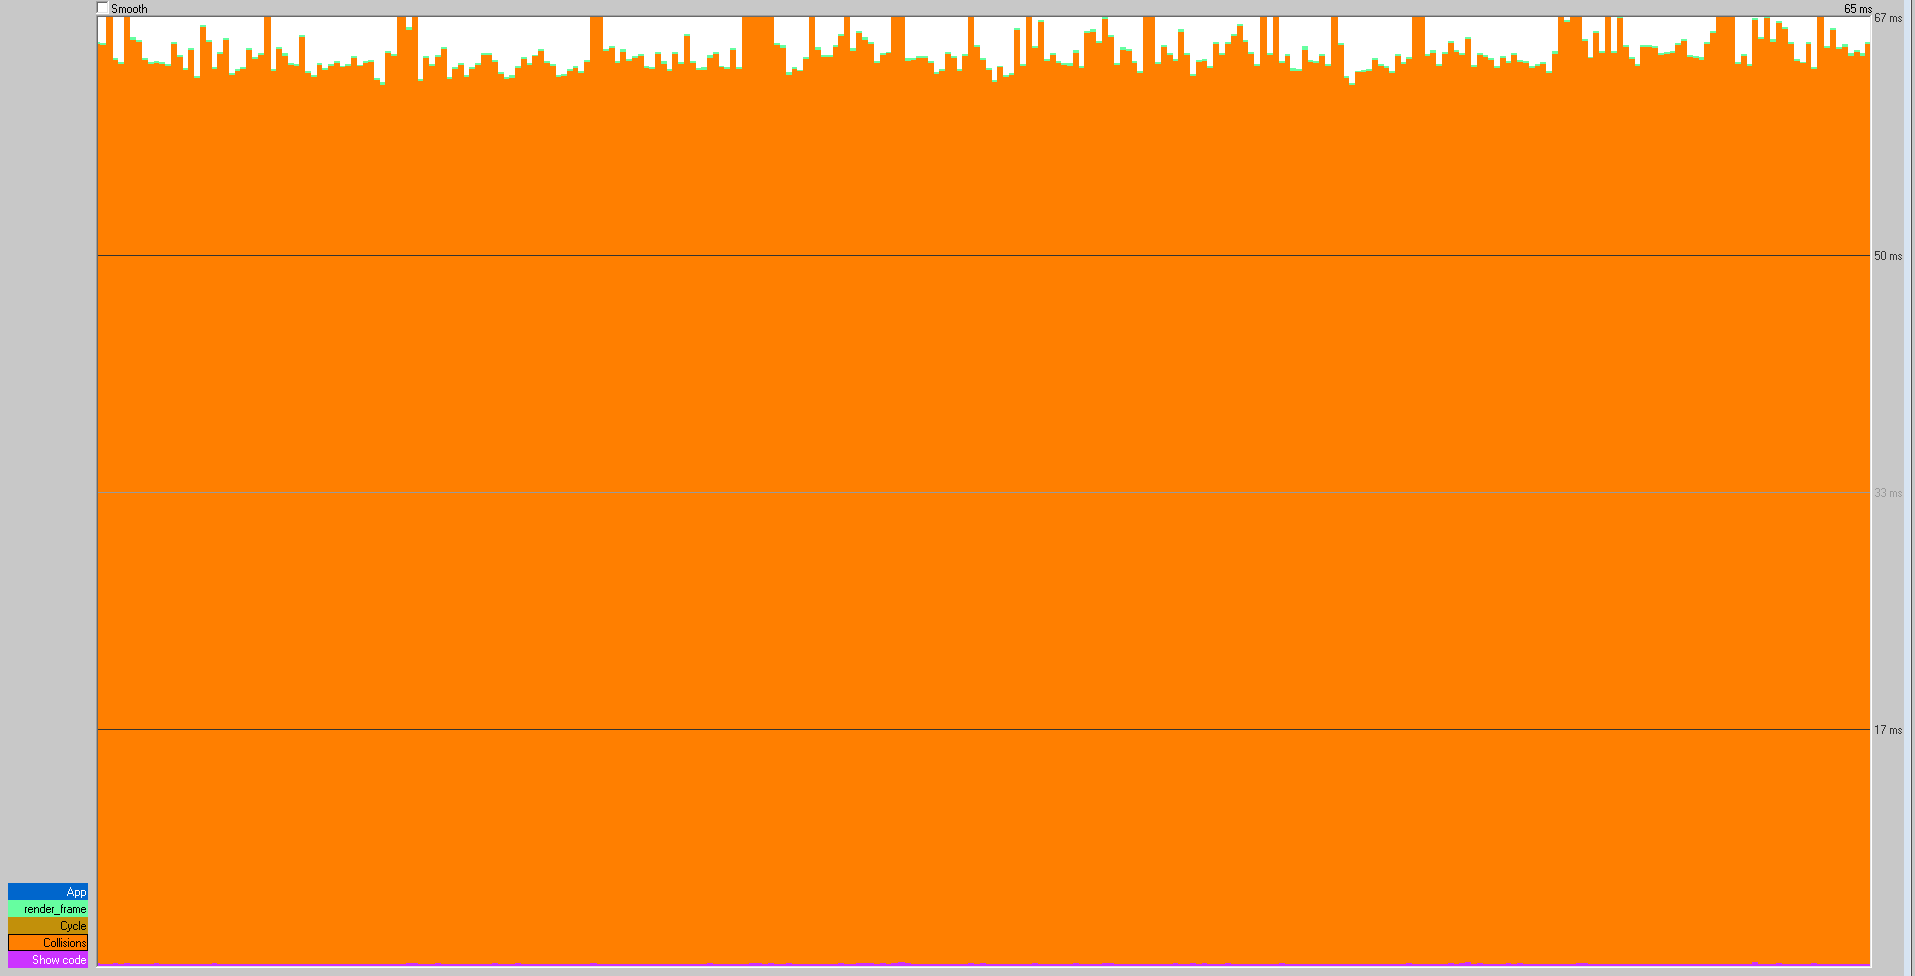
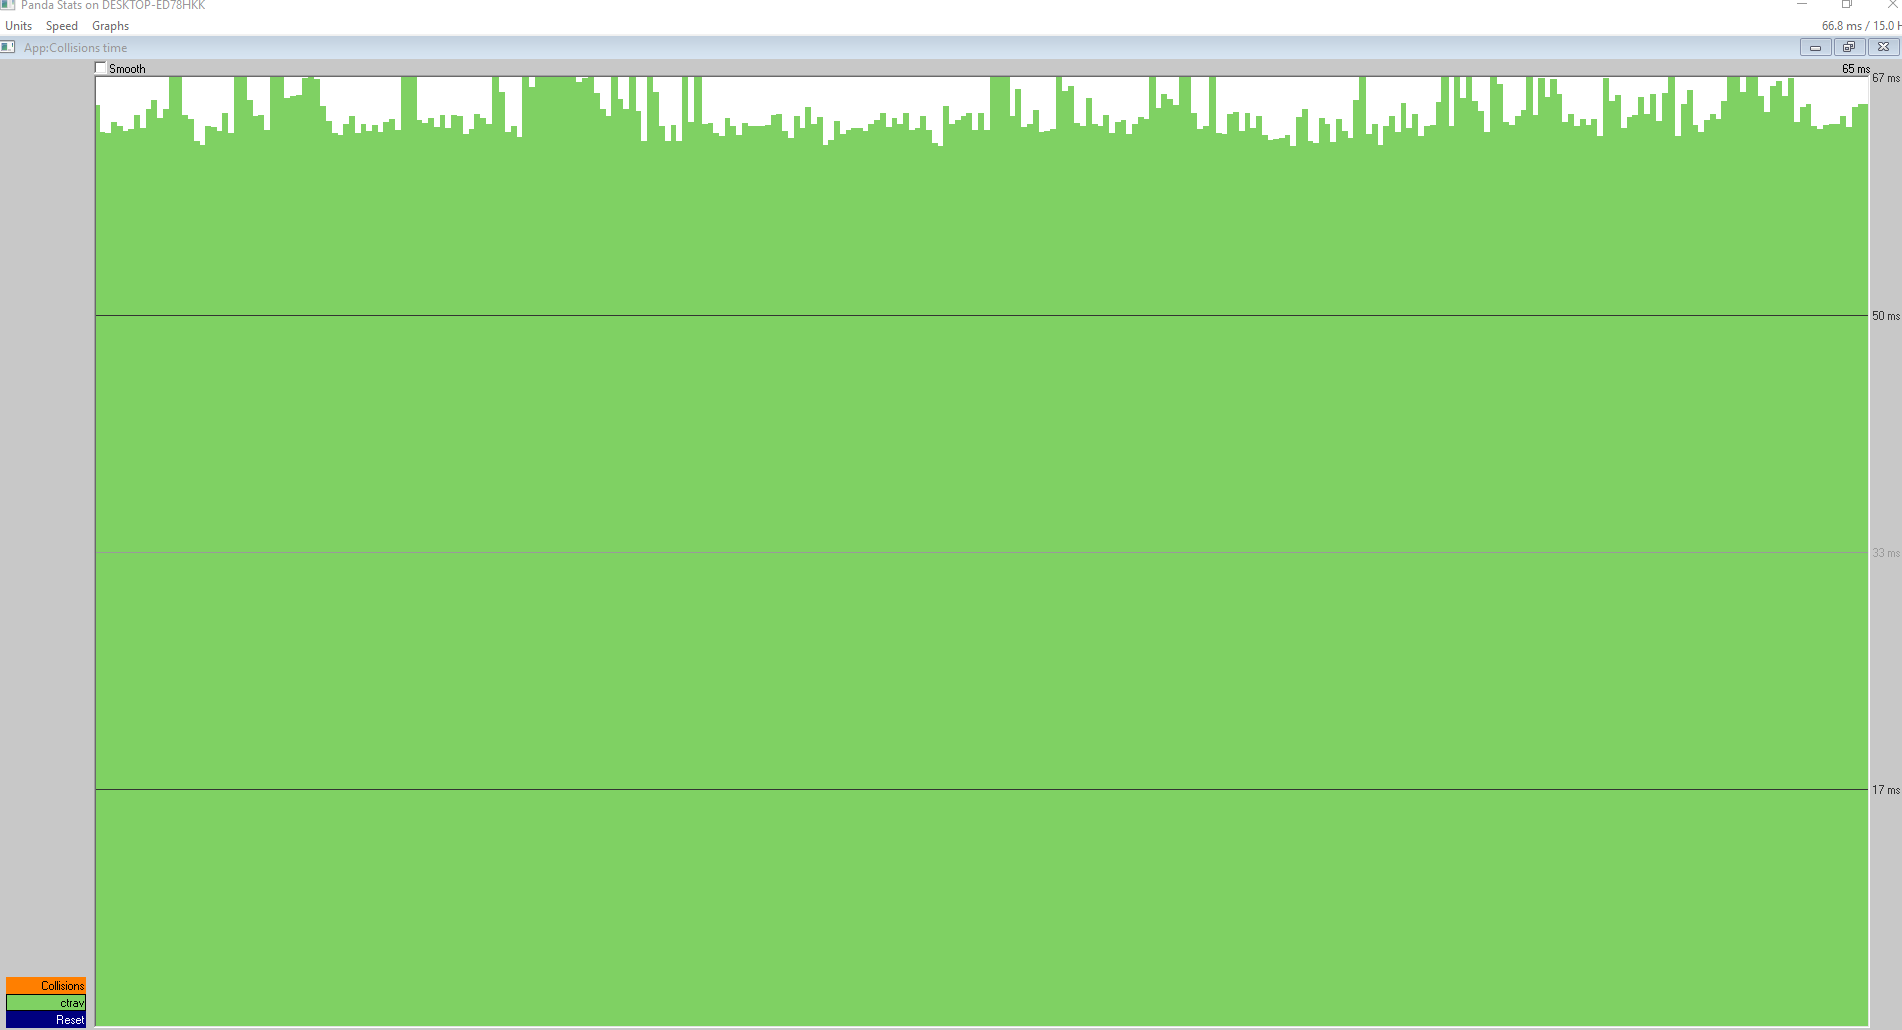
So, to begin with, I want to say that I did a little bit more experimenting and I found this out. While having all 6 enemies loaded and returning task.cont to actually update the enemies appropriately, I am getting about 15 FPS as you all know. However, if I spawn 6 enemies on the map and do not return the loop to actually update the enemies, I am only getting a +5 FPS so I am getting only 20 FPS with all of the enemies sitting there doing absolutely nothing and not running any code.

So, for this check, running the basic code still only gives me 60FPS. It is highly possible this is due to my computer?

So, It does seem that I excluded some text.

With no enemies:

239 total nodes (including 0 instances); 0 LODNodes.
103 transforms; 1% of nodes have some render attribute.
122 Geoms, with 118 GeomVertexDatas and 5 GeomVertexFormats, appear on 118 GeomNodes.
257045 vertices, 257045 normals, 0 colors, 257045 texture coordinates.
GeomVertexData arrays occupy 8067K memory.
GeomPrimitive arrays occupy 699K memory.
147 vertices are unreferenced by any GeomPrimitives.
95 GeomVertexArrayDatas are redundant, wasting 654K.
39 GeomPrimitive arrays are redundant, wasting 168K.
121474 triangles:
9786 of these are on 3270 tristrips (2.99266 average tris per strip).
111688 of these are independent triangles.
10 textures, estimated minimum 86108K texture memory required.

With one enemy:

(NOTE THIS BLOCK REPEATS FOR EACH ENEMY LOADED
4 total nodes (including 0 instances); 0 LODNodes.
1 transforms; 0% of nodes have some render attribute.
1 Geoms, with 1 GeomVertexDatas and 1 GeomVertexFormats, appear on 1 GeomNodes.
1515 vertices, 1515 normals, 0 colors, 1515 texture coordinates.
GeomVertexData arrays occupy 122K memory.
GeomPrimitive arrays occupy 13K memory.

2175 triangles:
0 of these are on 0 tristrips.
2175 of these are independent triangles.
2 textures, estimated minimum 14336K texture memory required.
246 total nodes (including 0 instances); 0 LODNodes.
106 transforms; 1% of nodes have some render attribute.
123 Geoms, with 119 GeomVertexDatas and 6 GeomVertexFormats, appear on 119 GeomNodes.
258560 vertices, 258560 normals, 0 colors, 258560 texture coordinates.
GeomVertexData arrays occupy 8188K memory.
GeomPrimitive arrays occupy 712K memory.
147 vertices are unreferenced by any GeomPrimitives.
95 GeomVertexArrayDatas are redundant, wasting 654K.
39 GeomPrimitive arrays are redundant, wasting 168K.
123649 triangles:
9786 of these are on 3270 tristrips (2.99266 average tris per strip).
113863 of these are independent triangles.
12 textures, estimated minimum 100444K texture memory required.

I know that I have loaded multiple enemies before and not seen any frame lag. It’s just weird that I do now receive frame lag even when the enemies arent being updated. Also I apologize but I still have yet to get Pstats to work on my PC to my macbook to actually give you more needed information

I apologize, but could you elaborate on the exact syntax? Calling flatten() or render.flatten() gives me errors like “NameError: name ‘flatten’ is not defined.” or “‘Game’ object has no attribute ‘flatten’”
I would assume this command would need to be imported but I am not sure what to import.

Don’t worry about it, to speak for myself at least! This is, after all, a forum: a variable duration between responses is expected. :slight_smile:

Okay, so it’s unlikely to be that section of code, at least.

If it’s holding steady at 60fps, then it may well be that your card has V-sync enabled, and is capping your frame-rate at that value. If so, then it’s not necessarily true that any additional burden on rendering would noticeably reduce your frame-rate: There may well be a fair bit of time that remains unused between syncs, and it may be that only after that time is taken up by your project that further burden would have much effect.

I imagine that brightening-eyes was referring to the “flatten” family of methods–“flattenLight”, “flattenMedium”, and “flattenStrong”. See here for more information: Too Many Meshes — Panda3D Manual

(I’m not terribly familiar with the output of “analyze”, so I’ll leave that for others to interpret, I think!)

Hello, @Triumphant. Maybe I’ve missed your post, but have you tried running pstats as Thaumaturge suggested? It will show you what part of the game loop takes most of the frame time - app, cull or draw. This can be useful.

EDIT: sorry, I overlooked what you posted about pstats.It’s a pity you can’t use it.

Another suggesion then: remove ANY Python code related to enemies, just load the model and place 6 instances, will this scene be as slow?

Going further, remove any game logic (or better write a new script from scratch) that only loads level geometry and enemies, but no logic.

Also, to turn off vsync, put sync-video #f in your Config.prc.

2 Likes

@Thaumaturge yes I ment this.
I couldn’t remember the name of the method correctly (as we have flatten in deep learning so I made a mistake. sorry).
another thing is to run your taskk in another thread and look for the performance (this should encrease it).
also, replace your egg model with another one or turn them into bam ones and check the performance if the problem is your models.

1 Like

Okay, so before I go into detail for what @maxxim is suggesting or @brightening-eyes, I did finally make pstats to work on my PC. So perhaps we can analyze this data and then move into one of the other methods if we still cannot unravel the issue. With my little understanding of Pstats, it seems like the issue is coming from the way I am using traversers? Perhaps, I need to read up on how to better use ctrav.

Here is what the graphs show :

Thanks! From the first screenshot you can see that the problem is not rendering at all, the draw commands ccpupy a tiny slice of your frame time. So yes, it must be collision traverser. And it is weird, because collision traverser is a C++ class and it should work pretty fast. Check in your Python code that you are not creating multiple collision traversers in a loop.

P.S. So I guess it doesn’t make sense to check your level geometry since you already know the problem is not in the rendering.

1 Like

Hmm… Could it be that you have multiple overlapping colliders that shouldn’t interact, at least one of which is active (i.e. added to the traverser, and/or to a pusher) and that you don’t have bitmasks preventing them from interacting with each other?

For example, you might give an enemy a sphere collider that prevents it from moving through walls, and a cylinder collider that allows the player to hit it, or a ray that allows it to detect the player. They belong to the same enemy, so it doesn’t make sense for them to interact with each other–but if you haven’t set masks to prevent it happening, then they likely will interact. And more, they’ll keep interacting, every single frame, impacting performance.

1 Like

Are you colliding with visible geometry or with pregenerated collision polygons? The former is very slow, the latter is significantly faster.

It’s easy to accidentally be setting up your colliders to do both, by setting the wrong collide masks.

2 Likes

Thank you all for your replies! So, from what I’ve seen @Thaumaturge it doesnt seem like my colliders should be interacting with each other. Basically, I have four pre-generated collision polygons @rdb . Two of which, I reparent all of these to render and for two of them, I keep at the foot of the enemy, while the other two I raise the Z elevation to be in the air. Since I probably wont be as good at detecting the issue are the rest of you, I have decided to include all my code for initializing the colliders. Lastly, @maxxim , I only initialize these nodes once.

For the first node,
base.pusher.addCollider(self.collider, self.actor)
base.cTrav.addCollider(self.collider, base.pusher)
mask = BitMask32()
mask.setBit(1)
mask.setBit(2)
self.collider.node().setFromCollideMask(mask)
mask = BitMask32()
mask.setBit(2)
self.collider.node().setIntoCollideMask(mask)

for the second node,
self.attackSegment = CollisionSegment(0, 0, 0, 0, 1, 0)
segmentNode = CollisionNode(“enemyAttackSegment”)
segmentNode.addSolid(self.attackSegment)
mask = BitMask32()
mask.setBit(1)
segmentNode.setFromCollideMask(mask)
mask = BitMask32()
segmentNode.setIntoCollideMask(mask)
self.attackSegmentNodePath = render.attachNewNode(segmentNode)
self.segmentQueue = CollisionHandlerQueue()
base.cTrav.addCollider(self.attackSegmentNodePath, self.segmentQueue)

for the third node (in the air),
self.LoSEnemy = CollisionNode(“LoSEnemy”)
self.LoSEnemy.addSolid(CollisionSphere(0, 0, 0, 0.6))
self.LoSePath = render.attachNewNode(self.LoSEnemy)
self.LoSePath.setPythonTag(“EnemySight”, self)
self.LoSeQueue = CollisionHandlerQueue()
base.cTrav.addCollider(self.LoSePath, self.LoSeQueue)
self.LoSePath.setPos(self.actor.getPos()+Vec3(0,0,1.5))
self.LoSePath.show()
#Parameters for Line of Sight
mask = BitMask32()
mask.setBit(4)
self.LoSEnemy.setIntoCollideMask(mask)
mask.setBit(4)
self.LoSEnemy.setFromCollideMask(mask)

for the fourth node(in the air),
self.LoS = CollisionNode(“LoS”)
self.LoS.addSolid(CollisionSphere(0, 0, 0, 0.4))
self.LoSPath = render.attachNewNode(self.LoS)
self.LoSPath.setPythonTag(“Sight”, self)
self.LoSQueue = CollisionHandlerQueue()
base.cTrav.addCollider(self.LoSPath, self.LoSQueue)
self.LoSPath.setPos(self.actor.getPos()+Vec3(0,0,1.5))
self.LoSPath.show()
#Parameters for Line of Sight
self.EnemySightRange = 10
mask = BitMask32()
mask.setBit(5)
self.LoS.setIntoCollideMask(mask)
mask.setBit(5)
self.LoS.setFromCollideMask(mask)