Okay, when your program connects to PStats, you should see a GUI open up with a menu-bar at the top, and a graph open up in a separate window.
To start with, I’d suggest looking at that graph–what frame-time does it report at the top-right, and how are the colours of the graph distributed?
If called for, note that you can double-click on the colours, or on their entries in the legend to the left, in order to “drill down” and see what comprises them (if anything).
Depending on the results of that, it might be worth trying a few of the other graphs that PStats provides. To do this, go to the menu-bar, select the “Graphs” menu, and click on the item that you want to see graphed. This should then open a new window presenting the indicated graph, much as with the default graph.
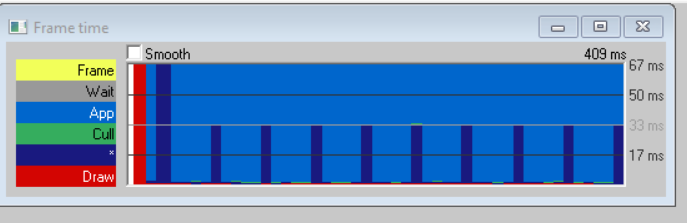
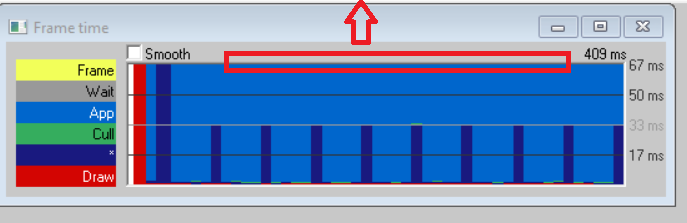
The frame-time that is displayed in the top right corner is around 411-420ms it will fluctuate a little higher or lower than the specified values but not by much. The colours the graph is showinig me are mostly dark blue and like blue (the background is completely blue with dark blue bars/spikes) there will be some red spikes every now and then. (I will add an image below of when the scene loads)
To be completely honest with you i dont know much about what any of this means
In short, the colours show where in your application time is being spent: the taller the colour, the more time is being spent there. So from your screenshot, we can see that much time is being spent in “App” and “*”.
(Alas, the above-linked page doesn’t seem to mention what “*” is, and I don’t recall offhand.)
But either way, the next thing that I’d suggest is to “drill down” into those sections (as I described in my previous post) and see what specific sub-sections are taking up time.
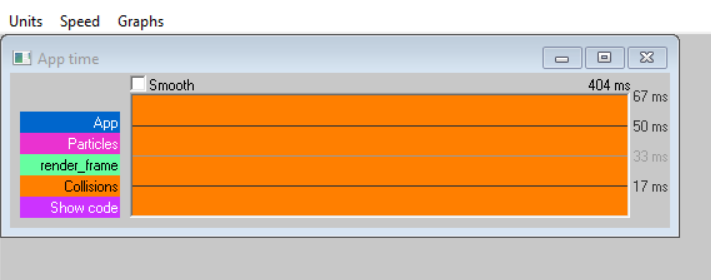
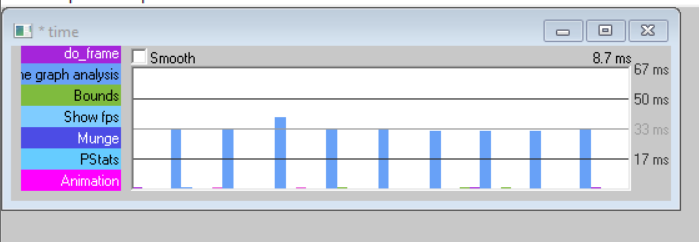
When i drill down into the app section it tells me that all of it is taken up by collisions (orange) and the spikes in the “*” section are either taken up by the showFPS or the PStats itself (I can’t really tell to which one as the colours are very similar)
(Below are pictures of both sections for reference)
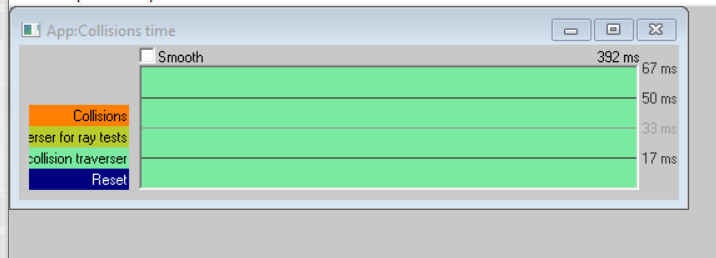
First, let’s just check that result: since the bar in the first screenshot is extending past the top of the graph, you might want to re-scale it so that the full thing can be seen, with all of its components.
To do this, click-and-drag on the graph and “pull” it downwards.
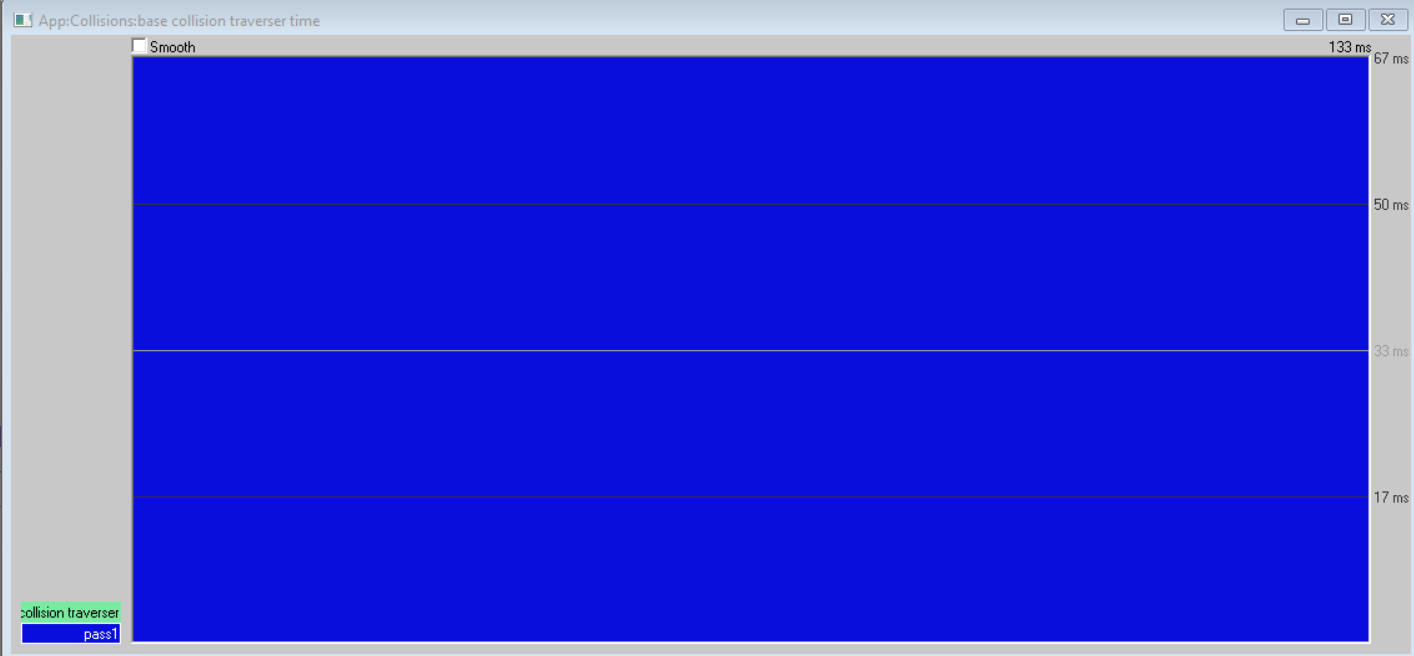
It might also be worth “drilling down” into “Collisions” itself, to see whether the issue is in, well, collisions, or some other sub-component. These graphs can have multiple levels!
Think of it like this: everything that the program does takes time, not so? Thus sections of code can be grouped together, and that group will take (more or less) the same amount of time as the that taken by each individual piece of code all added up.
What we’re seeing in PStats, then, is the amount of time taken by various code-groups. In this case, the traverser.
(Again, it would likely help if you were to re-scale the graph, as I described above. That way you wouldn’t see just a wall of blue. You’d be able to see each section relative to the other sections.)
As to what to do about this, hmm…
The fact that the traverser is taking so much time suggests to me that either your model is very inefficient, or your collision-related code is.
For example, perhaps you have lots of objects, and they’re all “active” objects–all added to a collision-handler. This might be overloading the traverser.
Or perhaps your model is extremely high-poly (possibly by virtue of inheriting its geometry from visible geometry). That too might be too much.
So, the next thing is to find it where the problem lies.
Which I suppose brings me to my next question: aside from your level-model, do you have a lot of collision-objects?
That is the resized image, i made the PStats GUI full screen and dragged the graph as down as far as it would go but its still a blue wall. The only objects that are in the scene are the surrounding environment, the maze and the player. Collision solids i have are a plane for the ground and an CollisionInvSphere to stop the player from going off the edge of the environment.
I am using FireclawTheFox/wolf’s character controller with their fox model which I believe has a collision sphere for the player collision solid so all together there are no more than 3/4 collision objects, which i have tried to delete/comment out to see if it makes a difference on the performance but it does not
(And my apologies, then–it was my mistake to think that you hadn’t resized it! ^^; )
Hmm, okay. In that case it seems likely that the problem lies with your maze’s collision-geometry.
How detailed is the collision-geometry that you’re using for the maze?
Further, you said that you’re using “collide” tags in Blender–are you applying those to visible geometry, and then using the “keep” value in the “collide” tag so that you get both visible and collision geometry? Or is your collision geometry separate from the visible geometry in Blender?
And wow, things do slow down if I view the collision geometry in PView!
In short, I think that the problem is that you’re using the same source mesh for both your visible geometry and your collision geometry. Specifically, since your visible geometry is fairly detailed, your collision geometry also is. And while geometry of this detail is fine for visible geometry, I fear that it’s rather too complex for collision.
(It’s possible that the problem is something related but different, such as the presence of rather narrow triangles. However, I think that the suggested solution would likely be the same in at least some such cases.)
What I suggest is that you create a separate, simpler mesh for your collision geometry, and then attach the “collide” tag to that. (Without “keep”, of course, so that it doesn’t show up as visible geometry too!)
Okay, thank you! just so I understand your solution better what I should do is create a simpler version of the maze (cut down most of the geometry) and then layer the new collision geometry on top of the visible geometry? So should I remove the collide tag in the .egg file I have now? if that is the case, how do I put these two files together to have the visible geometry and the collision geometry?
Remember: you can have multiple objects in a single Blender-file.
So, what I suggest is that, in your maze’s Blender-file, you create a new object that follows the form of the maze, but with simpler geometry.
Then remove the “collide” tag from the visible geometry, and instead place it on the new geometry, but without “keep”.
And finally, export the Blender-file as you did previously!
To check your work, load the resultant file into PView. At first, you should see only your visible geometry. When you press “shift-C”, however, you should see your new collision-geometry appear, semi-transparent, along with the visible geometry.
[edit] I presume that blend2bam will export more than one object in a Blender-file, as YABEE does. However, I don’t use blend2bam myself, and so may be mistaken.
BTW you zoom out in pstats by dragging this edge up.
Collision mesh should be as simple as possible. You should use big planes and boxes for collision mesh around your model in blender. Then export it. Or maybe as temporary solution you could try to duplicate your visible mesh and then use decimate in blender to reduce the complexity and use that for collision mesh. I didnt try this myself tho and probably will be still slow.